Fuel ethanol fermentation is a complex biological process where complex sugars and carbohydrates are broken down by enzymes, providing food for yeast to ferment into ethanol. HPLC is commonly used to monitor and control the process, but samples are only taken every 8 hours, take 30 minutes to run through the HPLC instrument, and give sporadic, disjointed information about the fermentation.

Spectrometers allow continuous and detailed measurement of chemical concentrations in real time. Unfortunately, the majority of process spectrometers are based on near infrared light, which is fundamentally less informative than mid infrared light. Conventional mid infrared spectrometers (which often use a Fourier transform and are referred to as "FTIR spectrometers") have sensitive moving parts and fragile fiber probes – making them wholly unsuitable for production environments such as ethanol refineries.
The IRmadillo is a process analyzer built using FTIR spectroscopy, but with static optics: removing the need for moving mirrors or fiber probes, and dramatically improving stability, reliability, and ruggedness.
Example use case
This application note presents data collected from a recirculation line in the fermenter at an ethanol refinery in Iowa, measuring the chemicals typically monitored using HPLC – DP4, DP3, maltose, glucose/dextrose, acetic and lactic acids, glycerol and ethanol. By measuring all of these in real-time, the customer was able to spot problems early (such as bacterial contamination or inactive enzyme), as well as get much more usable data for process and production improvements in the facility.
Results
Individual models were built for each chemical, with their own performances:
Sugars typical average error = 0.4 %
Lactic and acetic acid typical average error = 15 ppm
Ethanol average error = 0.15 %
Glycerol average error = 50 ppm
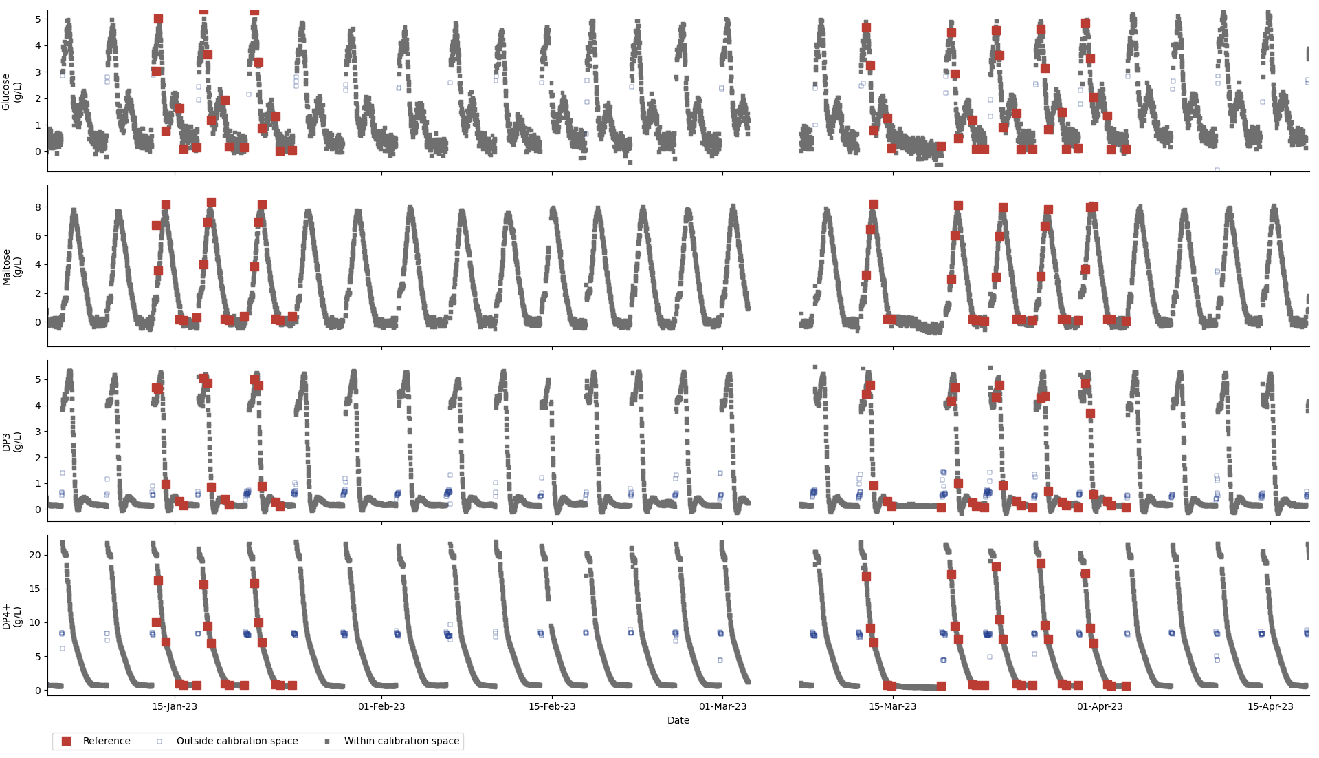
Figure 1: Measurements of DP4+, DP3, maltose and glucose/dextrose over a period of several months
This performance certainly allows for real-time problem monitoring and detection: for example, an increase in lactic acid indicating that a bacterial contamination has occurred, and antibiotic dosing would be a solution to prevent a failed batch. But by using these measurements it is also possible to start process improvement experiments in the facility and gain meaningful information about how the fermentation is performing (such as finding the optimum set point for heat exchangers or dosing rates of enzyme). Additionally, experiments can be trialed with confidence that if the fermentation starts to go in the wrong direction the operator will be told early enough that they can stop the experiment and revert to a standard fermentation.

Figure 2: Measurements of ethanol, acetic and lactic acids and glycerol over a period of several months
Ultimately, the customer has plans to document the “golden batch” in their facility and build an expert system that guides every batch towards the golden batch. This would reduce variation and increase ethanol per bushel of corn – dramatically improving profit of the refinery.
Conclusions
This work has shown that the IRmadillo spectrometer is easy to install into a recirculation line on the fermenter, and can be calibrated to become a continuous, in situ and real-time concentration meter – providing all the information HPLC does, enabling problem resolution and process optimization.
Keep in Mind
The IRmadillo can be calibrated to measure a large range of chemicals at the same time. This work shows the use for DP4+, DP3, DP2, glucose/dextrose, lactic and acetic acids, glycerol, and ethanol measurement, but it can also be calibrated to measure FAN, PAN and fusels – all at the same time, in real-time.